Phin allows admins to turn on the ability for automatic monthly and weekly reporting. These reports show general information regarding a specific company and their Security Awareness Training and Phishing Simulation statistics.
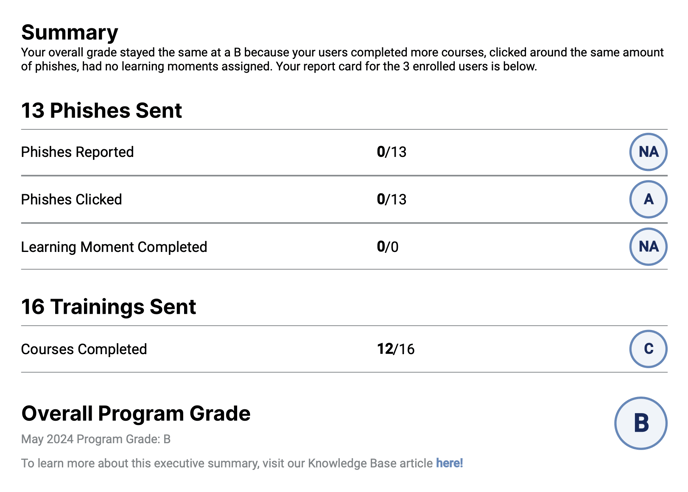
The report is broken up into several different pages outlining high-level stats, trends for phishing and training, and statistics for the current month. The report can also be configured to include additional data; a dump of historical user data for the last twelve months and/or a table of “Users to Watch”.
Phin Sample Report:
Configuring Reports
To enable reports simply go to the specific company’s “Reporting” page. Next, configure monthly and weekly reports separately. Configure the time the report should be delivered. You can also customize the report by including “Historical User Data” table and/or “Users to Watch” table as well as .csv files. Lastly, add the email addresses of report recipients.

Report Data
High-Level Stats
The first page of the report shows some high-level stats for the company.
- How many users are enrolled in phishing campaigns and training campaigns
- How many phishing emails have been sent in a month
- The percentage of users who have clicked on a simulated phishing email this month
- How many security awareness training courses were assigned this month
- How many users completed this month's training
- How many users completed all of their assigned training for the last twelve months
Trend Data
The trend data page shows a bar chart representing the percentage of users who have clicked on a phishing email in the last twelve months. Over time this chart should begin to show the positive effect Phin is having on this company.
The final chart on this page is a visual representation of the percentage of users who have completed all of their assigned training in the last twelve months.
Historical User Data and Users to Watch
The “Historical User Data” table will contain the list of all active users who have been assigned training or sent phishing test emails in the last 12 months, sorted alphabetically. ‘Users to Watch’ is filtered to highlight users who are not up to date on their security awareness training or who clicked on a phishing test this month. Note that enabling both of these charts will dramatically increase the size of reports.
Additional Attachments:
CSV Output of Raw Phishing Data
You can optionally include CSV output of detailed click data for further analysis. You can learn more about this in the article “CSV Reporting (With Examples!)”.
Phishing Data PDF
You can optionally include a PDF showing phishing results. This PDF can be included in monthly reports, as well as ad-hoc reports, and will have the following info from the last month:
- The number of unique users assessed.
- The number of simulated phishes sent.
- The number of simulated phishes clicked.
- The percentage of simulated phishes clicked.
- A stacked bar chart of The Top Five Phishing Templates.
- Data of the users included in all Phishing Simulation Attempts.
You can toggle this option on for monthly reports:
And for reports generated ad-hoc:
Sample Report:


